The Ohio Department of Education strives to provide schools and districts with effective supports and high-quality resources so they can continually improve and focus on acceleration of learning. As educators use real-time information for guiding school improvement and responding to student learning needs, the Department offers state-level data that can put local data in context and provide insights into trends and phenomena to help inform state policymaking and action.
This edition of Data Insights looks at available information about the 2021-2022 school year and builds upon two previous reports on education trends during the COVID-19 pandemic. This update centers on the findings from an analysis of state administrative data and a new study by The Ohio State University on fall test performance trends. Please refer to the Data Insights homepage for previous articles that include more in-depth analysis of the 2020-2021 school year, as well as tips and resources for putting the data to use.
Key themes emerging from available data include the following:
- Education Delivery Models: Compared to school year 2020-2021, most Ohio districts were been able to maintain five-day, in-person instruction for their students in school year 2021-2022—a fact that could positively influence many education indicators to come.
- Student Enrollment: Fall 2021 enrollment in Ohio public schools was up this year across all district types and student subgroups, partially compensating for unusually large decreases between fall 2019 and fall 2020. Most of the changes have been driven by shifts in early grade enrollment.
- Kindergarten Readiness Assessment: With more complete participation this fall 2021, performance on the Kindergarten Readiness Assessment Revised suggests that Ohio’s youngest learners experienced setbacks during the pandemic in acquiring the skills necessary to be kindergarten ready—notably evidenced by a large decrease in the percent of students on track in the Language and Literacy domain.
- Fall Third Grade English Language Arts Test: Performance on the fall grade 3 English language arts test improved substantially between fall 2020 and fall 2021. However, it has not yet recovered to pre-pandemic levels, and Ohio’s most vulnerable students continue to be most impacted. In comparison to fall 2019 performance, fall 2020 third-graders showed over three months of learning lag, while fall 2020 students displayed only about one month of lag. Despite this statewide improvement, certain performance gaps widened during the pandemic—negatively affecting urban districts and districts that were primarily remote last school year, as well as English learners, students with disabilities and students who are Black.
- As the dedication of Ohio educators continues to move students toward academic recovery, the state and local education agencies are making immediate and sizable investments in strategies to help overcome obstacles to learning, accelerate learning and prepare students for future success.
Education Delivery Models
Education delivery models—that is, the mode in which schools and districts deliver instruction to students—have varied throughout the pandemic. In general, districts use an education delivery model that is five-day in person, fully remote or hybrid (for example, two days in person and three days remote). During periods of remote and hybrid instruction, Ohio’s schools and districts have worked to ensure students maintain their opportunity to learn.
From early in the pandemic, the Department provided weekly updates on which districts were using each of the three education delivery models. An analysis of models in use throughout school year 2020-2021 can be found here.
Conditions to start the 2021-2022 school year continued to require agility in how schools delivered education while protecting student health. In several parts of the state, COVID-19 cases and quarantines among students, educators and support staff presented disruptions and challenges throughout the fall and winter. However, the vast majority of districts were able to keep students in five-day, in-person instruction during the school year, standing in stark contrast to last school year.
The more common and consistent opportunity for students to learn in-person this year was a major development and cause of optimism. Ohio and national analyses over the past year suggest strong relationships between the availability of in-person education and fewer negative impacts on enrollment, absenteeism, test participation and achievement.
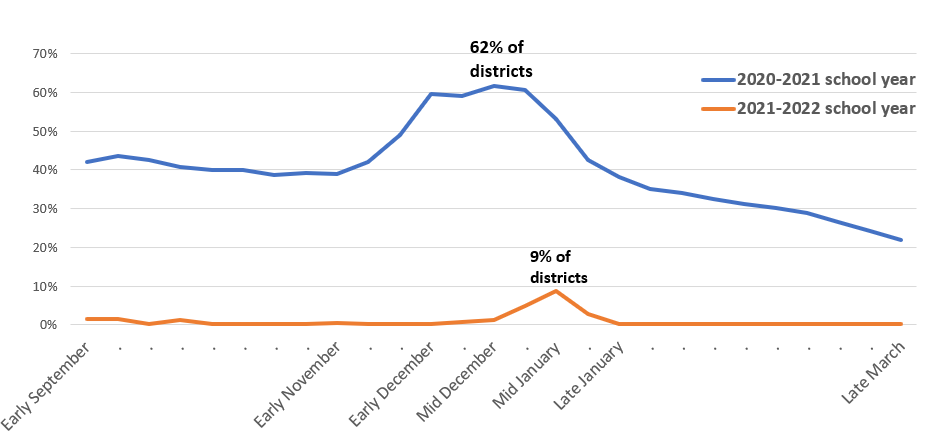
As displayed in Figure 1, nearly every week of the 2021-2022 school year was characterized by fewer than 3% of Ohio's traditional public districts using a fully remote or hybrid education delivery model. The exception was a five week span starting in mid-December.
As community cases spiked in mid-January 2022, 9% of districts (enrolling 34% of all students) turned to a remote or hybrid model or, in a few cases, extended their winter breaks. In comparison, the spike approximately one year prior in mid-December 2020 saw 62% of districts (enrolling 70% of all students) using a remote or hybrid model. In both school years, urban and more densely populated districts represented a large portion of those districts needing to shift away from in-person instruction.
Figure 1: Percentage of Districts Using a Fully Remote or Hybrid Education Delivery Model, Two-Year Comparison for September-March
Student Enrollment
Student enrollment changed in exceptional ways during the 2020-2021 school year. Parents and families faced tough decisions about the best options for the education, health and well-being of their students. Statewide analyses in a previous Data Insights article suggest these decisions included whether to delay enrollment in preschool or kindergarten, as well as which mode of instruction would best meet their children’s needs. Fall enrollment data for the 2021-2022 school year indicate the start of some counter trends, offsetting the enrollment changes of last year.
The enrollment numbers presented here reference fall head counts for districts and schools, which can be found on the Enrollment Data page. Full school year enrollment is available at the Education Report Portal (noting that full year data for 2021-2022 will not yet available until October 2022).
Overall enrollment in Ohio public schools began to recover in fall 2021, after a steep decline the previous fall. From fall 2019 to fall 2020, total enrollment decreased by nearly 53,000 students (2.9%), or 10 times the average annual decrease experienced by Ohio in recent years. From fall 2020 to fall 2021, however, total enrollment grew by almost 18,000 students—compensating for one-third of the prior year’s decrease.
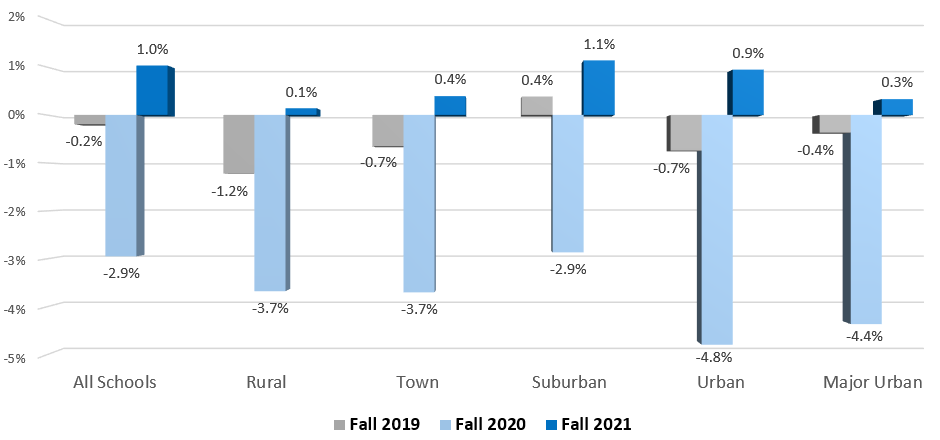
As shown in Figure 2, fall 2021 enrollment was higher across the district typology groups. Rural, town and major urban districts experienced less enrollment recovery, on a percentage basis, than did suburban and (minor) urban districts.
Well more than half of all traditional public districts (340) experienced an enrollment increase from fall 2020 to fall 2021, but 184 districts still had enrollment 5% or more below their fall 2019 level. See fall enrollment trends for individual districts for more information.
Figure 2: Annual Change in Fall Enrollment by District Typology
As displayed in Figure 3, all race and ethnicity categories had an enrollment increase from fall 2020 to fall 2021, although enrollment recovery for students who are white was less than for other groups.
Figure 3: Annual Change in Fall Enrollment by Race or Ethnicity
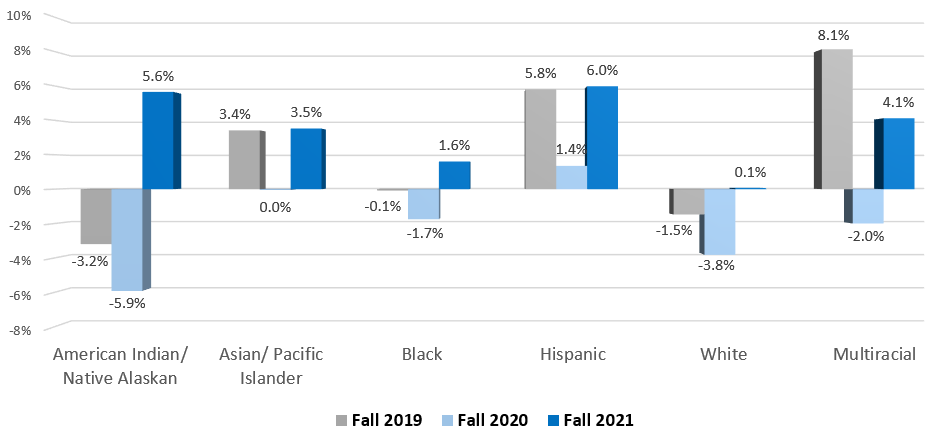
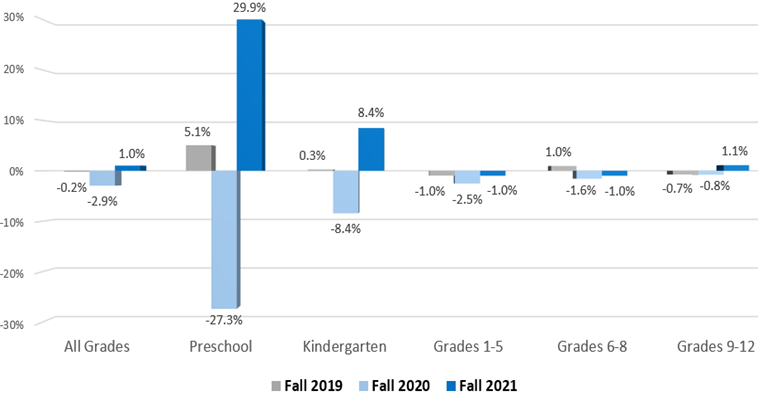
Figure 4 displays annual changes in fall enrollment by grade band. From fall 2019 to fall 2020, enrollment in preschool and kindergarten decreased by more than 25,000 students, representing almost half of the total enrollment decline for the state. However, both preschool and kindergarten had strong enrollment growth from fall 2020 to fall 2021, nearly compensating for the large decreases one year prior.
Other elementary and middle school grade levels (grades 1-8) were collectively down by 1% in fall 2021 compared to fall 2020. However, the high school grade band was slightly up, led by the ninth grade, which had a 4% increase in student enrollment.
Figure 4: Annual Change in Fall Enrollment by Grade Level
Looking at fall enrollment trends across school types and sectors in Table 1, the unusually large decreases in fall 2020 for traditional public schools, site-based community schools, career-technical schools and chartered nonpublic schools were in contrast to exceptionally large increases in e-school enrollment and home education participation. Last year’s growth in e-school enrollment was driven by a 254% increase in kindergarten enrollment along with strong growth in other elementary grade levels.
From fall 2020 to fall 2021, all school types and sectors experienced enrollment recovery or continued growth, with the exception of e-schools, whose collective enrollment fell by 10% (including a 33% decrease in kindergarten).
The modest enrollment growth for traditional public schools in fall 2021 was a result of preschool and kindergarten increases (+32% and +9%, respectively) that offset comparable decreases last fall.
Table 1: Annual Change in Fall Enrollment by School Type or Sector
Table 1A: By Percent
| Year |
Traditional Public Schools |
Site-Based Community Schools |
E-Schools |
Career Technical Schools |
Educational Service Centers |
Nonpublic Schools |
Home Education/ Home School |
| From Fall 2019 to Fall 2020 |
-3.6% |
-0.9% |
+49.8% |
-5.7% |
-23.3% |
-2.0% |
+26.2% |
| From Fall 2020 to Fall 2021 |
+0.7% |
+0.4% |
-10.3% |
+10.3% |
+21.0% |
+2.7% |
+10.3 |
Table 1B: By Student Count
| Year |
Traditional Public Schools |
Site-Based Community Schools |
E-Schools |
Career Technical Schools |
Educational Service Centers |
Nonpublic Schools |
Home Education/ Home School |
| From Fall 2019 to Fall 2020 |
-56,808 |
-768 |
+12,989 |
-5,493 |
-2,829 |
-3,272 |
+5,161 |
| From Fall 2020 to Fall 2021 |
+10,546 |
+328 |
-4,037 |
+9,301 |
+1,959 |
4,478 |
+2,553 |
Fall Assessments
Results from Ohio’s Kindergarten Readiness Assessment and fall third grade English language arts assessment represent the first statewide test results for the 2021-2022 school year. This section highlights the results of these two assessments and implications of the pandemic’s impact on student learning.
KINDERGARTEN READINESS ASSESSMENT
At the beginning of each school year, children in public and community school kindergarten programs are assessed using Ohio’s Kindergarten Readiness Assessment (KRA). This assessment includes ways for teachers to measure a child’s readiness to engage with instruction aligned with the kindergarten standards.
Ohio’s Early Learning and Development Standards (birth to kindergarten entry) are the basis for the KRA, and the assessment relates to four areas of early learning: social foundations, mathematics, language and literacy, and physical well-being and motor development. In fall 2020, schools statewide administered a shortened form known as the Kindergarten Readiness Assessment Revised, or KRA-R. (See the Kindergarten Readiness Assessment Revised Preliminary 2020 Administration Report for an analysis of the fall 2020 administration, including the substantial drop in participation rate due to the pandemic.)
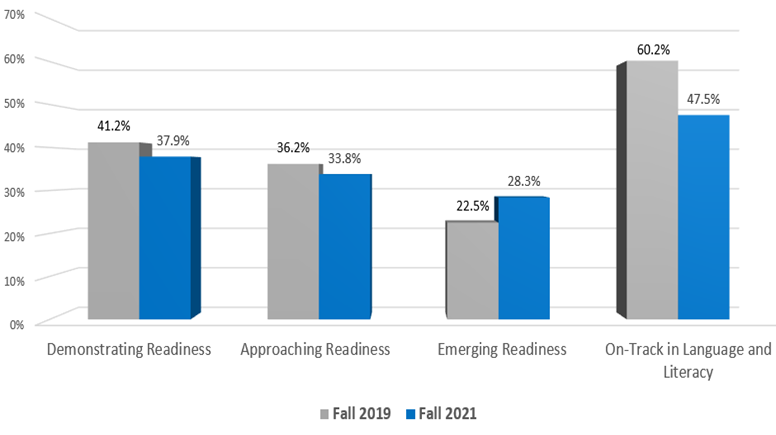
In fall 2021, participation on the KRA-R returned to a typical level, but evidence of the pandemic’s impact on incoming kindergarteners was apparent. As shown in Figure 5, fall 2021, in comparison to fall 2019, entailed a larger share of students identified in the lowest readiness category (“Emerging”) and a much lower rate of students as on track in the Language and Literacy domain of skills.
Disaggregated data suggest that students who are Black or Hispanic experienced somewhat larger declines in overall kindergarten readiness than their peers, but impacts were seen across student groups and throughout the state. In terms of being on track in Language and Literacy, the average decrease from fall 2019 to fall 2021 among rural districts (-16 percentage points) was even larger than that experienced by urban districts (-13 percentage points).
More details on state, district and school-level kindergarten readiness can be found on the Download Data page. To complement this article, the Department also prepared a KRA trend file that presents trends in state, county and district-level data over the past several years.
Figure 5: Distribution of Kindergarten Students by Overall Readiness Category and On-Track Status for Language and Literacy
FALL THIRD GRADE ENGLISH LANGUAGE ARTS TEST
The third grade English language arts assessment measures student proficiency on Ohio’s Learning Standards for English Language Arts in grade 3. The fall test is an early marker of student performance on those year-end standards, noting that students have another opportunity to take this test in the spring.
Over the past two school years, the Department’s understanding of the pandemic’s effects on academic achievement has benefited from the generous work of researchers at The Ohio State University (OSU). Two previous reports by OSU estimate the impacts in fall 2020 and spring 2021, and a newly released study for fall 2021 presents the findings below.
The methods employed by OSU seek to create "apples-to-apples" comparisons across three school years addressing compositional effects (such as differences in cohort demographics and prior performance) and the relatively low test participation rates in fall 2020 among some districts. These steps allow for estimates that better isolate the true impact of the pandemic on changes in performance.
Additionally, OSU’s process normalizes test scores across years allowing for comparisons in standardized deviation units, which can be interpreted in terms of learning lag time with respect to a previous student cohort. Based on recognized progression rates in the education research field, one year’s worth of learning between second and third grade is approximately 0.60 standard deviations, such that a decrease of 0.60 can be thought of as nine academic months of learning lag.
Both participation and performance of Ohio third-graders on the fall English language arts test improved substantially between fall 2020 and fall 2021. However, achievement remained lower than in fall 2019, with a dip in both average scores and the fall proficiency rate (-4 percentage points).
As show in Figure 6, students in fall 2020 were 0.23 standard deviation units behind students in fall 2019 (about 3.5 months of learning lag), while students in fall 2021 were only 0.08 units behind fall 2019, equating to just over a month of learning lag. Urban districts as a group continued to have a larger lag in fall 2020 than other district types.
Figure 6: Changes in Standardized Third Grade English Language Arts Scaled Scores Since Fall 2019 by District Typology
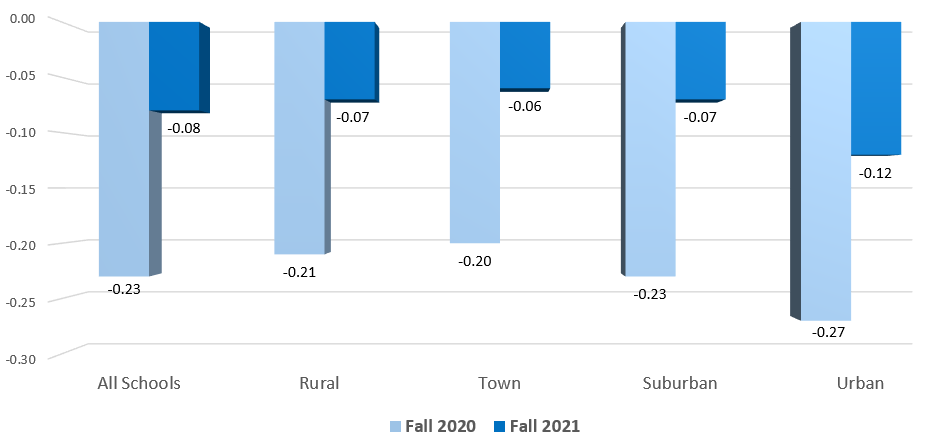
Figures 6, 7 and 8 present the average differences in normalized tests scores in standard deviation units compared to fall 2019. These are regression-adjusted estimates intended to partially account for differences in student test participation and composition in fall 2020 and fall 2021 assessments, compared to fall 2019.
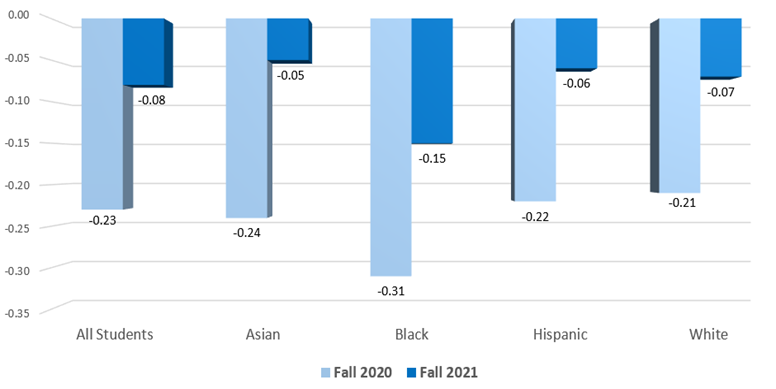
Every student subgroup examined by the study improved their average scores and proficiency rates from fall 2020 to fall 2021. However, some existing performance gaps between groups widened during the pandemic. In particular, fall 2021 results suggest third-graders who are Black fell behind an additional month more than their peers.
Figure 7: Changes in Standardized Third Grade English Language Arts Scaled Scores Since Fall 2019 by Student Race or Ethnicity
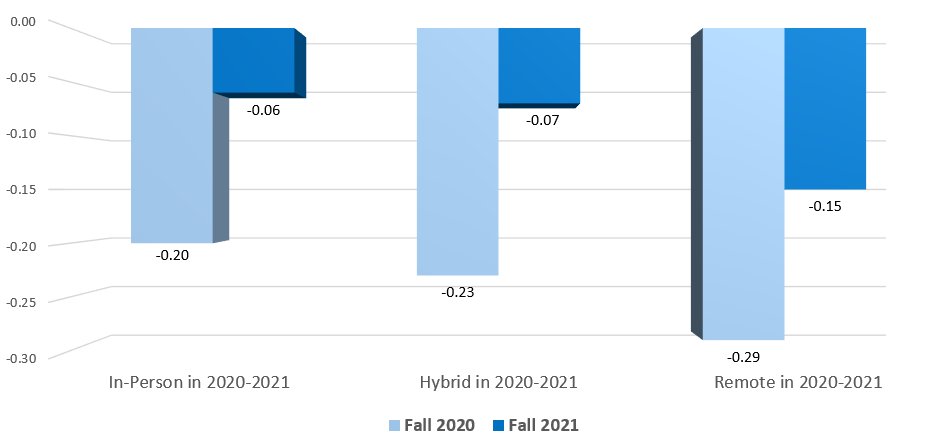
The modes of instruction available to students in the 2020-2021 school year remain associated with the impact of the pandemic on achievement this fall. Third-graders attending districts that spent most of last year in a remote learning model continued to post lower average English language arts scores in fall 2021. Comparing fall 2021 to fall 2019, these districts had learning lag that was more than two times the amount experienced by districts that were primarily in person or hybrid in the 2020-2021 school year.
Figure 8: Changes in Standardized Third Grade English Language Arts Scaled Scores Since Fall 2019 by Education Delivery Model in the 2020-2021 School Year
District-Level Data Files
To complement this report, the Department has prepared a Fall Grade 3 English language arts test trend file that covers district-level data over the past several years. These are preliminary measures based on data from the test vendor files that have not been verified through the EMIS submission process. It is important to note these data should not be used to rank districts nor compared to previous Ohio School Report Card results.
Building on the Momentum
Ohio is operating with a sense of urgency and possibility in addressing student learning lag and closing the learning gaps worsened by the pandemic. With federal COVID relief funds, the state is investing in strategies to overcome obstacles to learning, accelerate learning and prepare students for future success.
Accelerating learning means providing students with more and more effective opportunities to learn. To do so, the state is investing in programs to support schools and educators; for example, providing resources to assist districts in selecting high-quality instructional materials and creating more professional development opportunities for literacy instruction. At the same time, the state also is investing in programs with more direct and immediate impacts on students—dedicating $89 million in funding to support high-quality after-school and summer programming and $20 million to support a tutoring program that will draw upon higher education students in Ohio to provide tutoring to students in the K-12 system. Local educational agencies also have received significant federal funding that they are investing in a variety of strategies to accelerate learning. These commonly include summer learning programs, tutoring and hands-on learning experiences.
As new data arrives through spring and summer reporting, the Department will continue to provide updates on education system investments and the progress of Ohio students.
Please contact research@education.ohio.gov with any questions about the Data Insights articles.
Originally published: June 2022
Last Modified: 4/10/2023 11:20:56 AM